
Economics
(318)
Q.1. An average daily wages of all 90 workers in a factory is `. 60. An average daily wages of non-technical workers is 45. Calculate an average daily wages of technical workers if one-third workers are technical.
Ans: To calculate the daily wages of technical workers first wages of total workers and then non-technical workers is to be calculated and the same amount is to divided by the no of technical workers.
Total Worker = 90
One third of total worker is technical workers =90 x 13 = 30
Total wages of non-technical worker = No of non-technical worker multiply by average wages of non-technical worker
=60 x 45
=2700
Difference between the total wages of workers and the wages of non technical worker is amount of wages of technical workers.
=90 x 60=5400
=Rs 5400 – Rs 2700 = Rs 2700
Wages of technical worker divided by no of technical worker is equal to the average wages of technical worker
![]()
Average wages of technical worker is equal to the Rs 90 and Non technical is Rs 45.
Q.2. Calculate the median from the following data:
| Mid Values | 115 | 125 | 135 | 145 | 155 | 165 | 175 | 185 | 195 |
| frequency | 6 | 25 | 48 | 72 | 116 | 60 | 38 | 22 | 3 |
Ans :
| Mid value in an ascending | frequency | Cumulative frequency |
| 115 | 6 | 6 |
| 125 | 25 | 31 |
| 135 | 48 | 79 |
| 145 | 72 | 151 |
| 155 | 116 | 267 |
| 165 | 60 | 327 |
| 175 | 38 | 365 |
| 185 | 22 | 387 |
| 195 | 3 | 390 |
Median = size of = ![]() item = 195.5th item Cumulative frequency which includes 195.5th item = 267.
item = 195.5th item Cumulative frequency which includes 195.5th item = 267.
Medium = size of the item corresponding to 267 = 155.
Q. Find the range of given data
108, 107, 105, 106, 107, 104, 103, 101, 104
Maximum value is 108 and minimum value is 101
Hence the range is 108-101 = 7
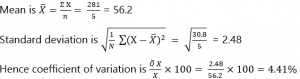
Q.3. Calculate the coefficient of variation for the following data set. The price (in), of a stock over five trading days was 52, 58, 55, 57, 59.
Ans :
| Days | Price (Rupees) | X-mean | (x-mean)^2 |
| 1 | 52 | -4.2 | 17.64 |
| 2 | 58 | 1.8 | 3.24 |
| 3 | 55 | -1.2 | 1.44 |
| 4 | 57 | 0.8 | 0.64 |
| 5 | 59 | 2.8 | 7.84 |
| 30.8 |
Q.4. Find the quartile deviation from the following table:
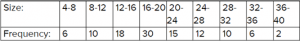
Ans :
Q.5. Calculate and analyse the correlation coefficient between the number of study hours and the number of sleeping hours of different students.
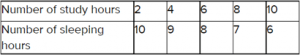
Ans : Given

let us assume X No. of study Hours and let us assume Y to be No. of Sleeping hours.
![]()
let us calculate the values first and then substitute its value in the formula.
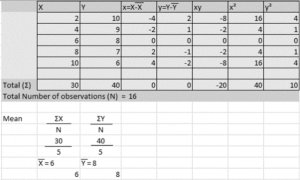
Substitute the above values in the formula.
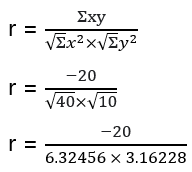
![]()
r = -1
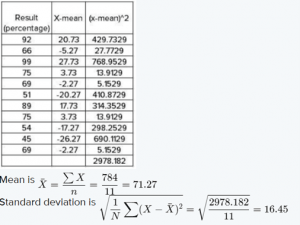
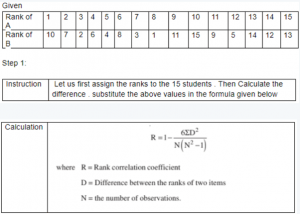
Q.6. The values of the same 15 students in two subjects A and B are given below; the two numbers within the brackets denoting the ranks of the same student in A and B respectively.
(1,10) (2,7) (3,2) (4,6) 7(5,4) (6,8) (7,3) (8,1)
(9,11) (10,15) (11,9) (12,5) (13,14) (14,12) (15,13)
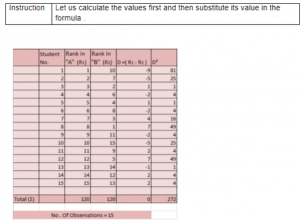
Use Spearman’s formula to find the rank Correlation Coefficient.
Ans :
Q.7. During a certain year, Cost of Living Index Number goes up from 110 to 200 and the salary of worker is also raised from 3250 to 5000. Does the worker really gain?
Ans : Given
Cost of living index number for the base year = 110
Cost of living index number for the current year =200
Salary of the worker in the base year = 3250
Salary of the worker in the current year = 5000
Real wages for the base year=(salary in the base year)/(cost of living index number in the base year)×100
=3250/110×100
= 2954.5455
Real wages for the current year =(salary in the current year)/(cost of living index number in the current year)×100
=5000/200×100
=2500
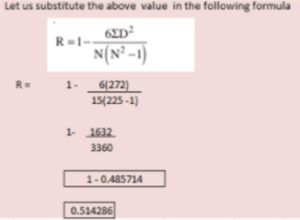
Q.8. The price relatives and weights of the set of commodities are given in the following table:
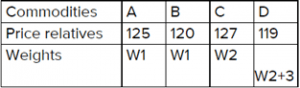
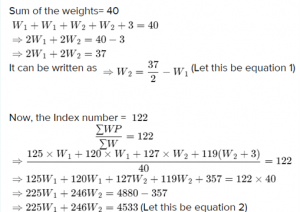
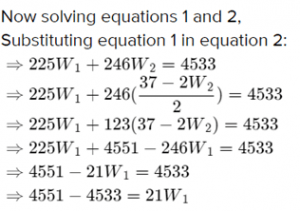
If the sum of weights is 40 and the index number for the set is 122, find the numerical value of W1 and W2.
Ans :
Q.9. Use the following to answer questions a-d:
A company buys four products with the following characteristics:
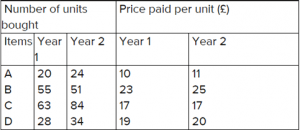
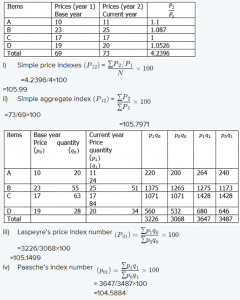
- Find the simple price indexes for the products for year 2 using year 1 as the base year:
- Find the simple aggregate index for year 2 using year 1 as the base year:
- Find the base-weighted aggregate index, the Laspeyres index, for year 2 using year 1 as the base year.
- Find the current period – weighted aggregate index, the Paasche index, for year 2 using year 2 using year 1 as the base year.
Ans :
Q.10. Explain the relationship between total utility and marginal utility.
Ans : Marginal utility is the option made to add up to utility by having an extra unit of the ware. Insofar as complete utility is expanding, marginal utility is diminishing up to the fourth unit. At the point when total utility is greatest in the fifth unit, the negligible utility is zero. It is the purpose of satiety for the purchaser.
Utility or Total utility (TU) alludes to the measure of all-out fulfilment an individual gets from utilizing a specific thing. Marginal Utility (MU) alludes to the additional utility a buyer gets from one extra unit of a particular item.
Q.11. Explain the properties of indifference curves.
Ans : An indifference curve is a diagram indicating a mix of two merchandise that give the purchaser equivalent fulfillment and utility. Each purpose of aloofness bend shows that a shopper is uninterested between the two. All focuses give him a similar utility. properties of detachment bend are :
- indifference curve are descending sloping
- higher detachment are liked to bring down ones
- The indifference curve can’t intersect.
- An indifference curve is arched.
Q.12. A consumer buys two goods X and Y. Explain the conditions of his equilibrium using utility approach.
Ans : The customer is purchasing the two merchandise X and Y inside his pay. The balance will be struck for utility methodology, At the point when the fulfilment driven from ware X and Y gets equivalent to the minimal utility of cash for the shopper, That is,
MUx = MUy = Mum.
Q.13. State and explain the law of demand.
Ans : The law of demand states that other things remaining the same (Tetris Paribus), the quantity demanded of a commodity is inversely related to its monetary value.
That explains that the demand for a commodity increase when the price decreases and the demand for a commodity decreases as the price increases while remaining other factors remain unchanged. For example, if the price of an apple is Rs. 20per Kg then the buyer tends to buy more kg of apple but if the price of an apple is increased to Rs. 200 per Kg then the buyer will buy less apple.
Q.14. Distinguish between expansion of demand and increase in demand.
Ans : Expansion of Demand means when the demand for a commodity increases as a result of a price fall. Price falls while the condition of demand remains the same.
An increase in Demand means when the demand for a commodity increases at the same price level. Price remains the same while conditions of demand changes.
Q.15 Distinguish between contraction of demand and decrease in demand.
Ans : Contraction of Demand means when the demand for a commodity decreases as a result of a price increase. Price increases while the condition of demand remains the same.
The decrease in Demand means when the demand for a commodity decreases at the same price level. Price remains the same while conditions of demand changes.
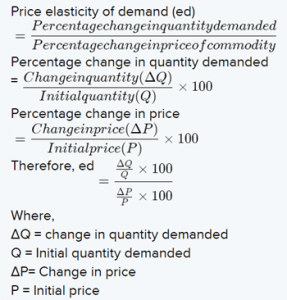
Q.16. Explain ‘percentage change’ method of measuring price elasticity of demand.
Ans :
Q.17. A household spends `120 on purchase of a commodity when its price is `6 per unit. When price rises to `10 per unit, his total expenditure on this commodity becomes 180. Calculate price elasticity of demand by percentage change method.
Ans : Calculate the change in quantity demand
Given ,
Initial price (P) = Rs. 6
Total purchase price = Rs. 120
Change in price (∆P) = Rs. 10
Total expenditure = Rs 180
Initial quantity demanded = 120 / 6
= 20 units
Change in quantity demanded = 180 / 10
Determine the price elasticity of demand
In formula,
Ed = ∆ Q / ∆ P x P / Q
Ed = (18 – 20) / (6 – 10) x 6 / 20
Ed = 0.15
Therefore, the price elasticity of demand of a household commodity is 0.15.
Q.18. How is price elasticity of demand of a commodity affected by availability of its close substitutes? Explain.
Ans : For some products, the required quantity is more in line with price changes than other products. For example, a small change in the price of luxury goods can greatly affect its demand, but a large change in the price of salt may not affect demand. This means that different goods have a different price elasticity of demand. Availability of close substitutes may affect the price elasticity of demand for a good which is explained below:
- Compared with products without substitutes, the demand for products with a large number of substitutes is usually more elastic.
- For example, Coke, Pepsi, limca, etc. are all good substitutes.
- Even a small rise in the price of coke will induce the buyers to go for its substitutes.
- On the other hand, since there are almost no substitutes for electricity demand, the elasticity of electricity demand will decrease.
- When substitutes are available, the amount required is very sensitive to changes in price levels and vice versa.
- The elasticity of demand for goods with similar substitutes is measured by dividing the percentage change in demand for a product by the percentage change in the price of that substitute product.
Q.19. Define production function.
Ans :
- In other words production function is a numerical-functional, technical, engineering relationship between inputs and output that with a given combination of factor inputs and technology at a given time, the maximum possible output can be produced.
- Such as land, labour capital, and entrepreneurship.
- Firstly, production function must be considered regarding particular time i.e. a short period and long period.
- Secondly, the production function is set on by the state of technology.
- Any pursuit that makes a product more useful is to collect production.
Q.20. Explain the relationship between APP and MPP.
Ans :
- The relationship between the 2 is that the MPP measures the speed of amendment of output whereas the APP measures the particular output levels.
- Therefore, the MPP acts as a driver for the APP since the speed of an amendment can directly affect the typical output.
- This is often why the MPP curve drops off most a lot of quickly than the APP.
- So as for the typical output to drop, the speed of (negative) amendment within the output should amendment even a lot of thus to own that result.
Q.21. Distinguish between AFC and AVC and describe how these are calculated.
Ans : AFC (Average Fixed Cost) is the per-unit fixed cost in producing a commodity or fixed cost per unit of output. Since fixed cost by its definition remains the same regardless of the volume produced the average fixed cost is distributed over a larger number of units decreasing the AFC.
AFC is calculated by dividing the total fixed cost (TFC) by the number of units of output produced.
AFC = 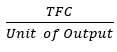
AVC (Average Variable Cost) is the per-unit variable cost in producing a commodity or variable cost per unit of output. Since variable cost by its definition changes with the change in produced volume the average variable cost is not directly distributed over a larger number of units but depends on the cost of each unit produced.
AVC is calculated by dividing the total variable cost (TVC) by the units of output produced.
AFC =
Q.22. Explain in brief the various determinants of supply.
Ans :
- Cost of the Good/Service: The obvious one of the determinants of flexibly is the cost of the item/administration. With all different boundaries being equivalent, the gracefully of an item increments if its overall cost is higher. The explanation is straightforward. A firm gives merchandise or administrations to procure benefits and if the costs rise, the benefit rises as well.
- Cost of Related Goods: Suppose that the cost of wheat rises. Henceforth, it turns out to be more productive for firms to gracefully wheat when contrasted with corn or soya bean. Subsequently, the flexibly of wheat will rise, while the gracefully of corn and soya bean will encounter a fall.
- Cost of the Factors of Production: Creation of a decent includes numerous expenses. On the off chance that there is an ascent in the cost of a specific factor of creation, at that point the expense of making merchandise that utilization a lot of that variables encounters an enormous increment. The expense of creation of products that utilization generally more modest measures of the said factor increments possibly.
Q.23. Distinguish between decrease in supply and contraction of supply.
Ans :
| A Decrease in supply: | Contraction of supply: |
| At the point when we state there is a move in the supply curve to one side then it implies the whole flexibly bend has moved to one side. | Constriction of supply happens when there is a fall in the cost of the item. Here the effect of value fall is plotted on a similar gracefully bend. |
| The supply curve movements to one side when there are changes in components other than the cost of the item bringing about diminishing inflexibly. | In the event that there is a fall in the cost of scones, at that point, this will prompt less flexibly of bread rolls on the lookout. Here the main explanation is the value (the wide range of various elements are kept steady) will cause the variety (fall) inflexibly. |
| Let us take an illustration of rolls. In the event that there is ascend in the cost of information sources, at that point the expense of creation will increment. Because of this the makers may gracefully fewer rolls on the lookout. This will prompt lessening in the flexibly of scones along these lines moving the gracefully bend of rolls inwards (to one side). | Decrease in supply is appeared on a similar gracefully bend. |
| The lessening in gracefully is appeared with the assistance of two flexibly bends. | |
| Decrease in supply shows the progressions on a similar flexibly bend. Here there is a descending development along with a similar gracefully bend. |
Q.24. State the curves of increase in supply.
Ans : The supply curve will move upward from left to right, which communicates the law of gracefully: As the cost of a given product expands, the amount provided builds (all else being equivalent). All in all flexibly will increment.
Innovation is the main source of gracefully bend shifts.
Q.25. Explain the percentage method of determining elasticity of supply.
Ans :
- es = Percentage change in quantity supplied / Percentage change in price
- This method helps to calculate the accurate value of price elasticity of supply.
- This method measures the degree of responsiveness of quantity supplied of a commodity to change in its price.
Q.26. What is the distinguishing feature of unitary elastic supply?
Ans :
- When the ratio of change in quantity supplied of a commodity to the change in price is one, the supply of the commodity is called to be unitary elastic.
- This means that if the price of commodity increases by 50 % then the quantity of supply of a commodity will also increase by 50 %.
- Commodities having unitary elastic supply have price elasticity value es = 1.
Q.27. Explain important functions of commercial banks.
Ans : This kind of record is commonly kept up by families or people. The contributor can store or pull out cash kept under this record just for a set number of times. This record likewise draws in an ostensible pace of revenue payable to the account holder. Under this record, cash is kept for a fixed period and the pace of revenue is moderately higher than different records relying upon the residency of the fixed store.
Q.28. What are the important functions of central bank?
Ans :
- Caretaker of the money stores of the business banks (CRR).
- Moneylender of the final retreat as in if business banks neglect to produce enough money from its own sources it moves toward the focal bank if all else fails.
- The national bank thus may allow credits and advances to the destitute banks.
- The national bank additionally goes about as a focal clearinghouse for the business banks.
Q.29. What is a commercial bank?
Ans : The business bank is a monetary organization that is fundamentally worried about tolerating stores from the public and loaning to the public other than others. These banks work both under people in general too private areas. A few public area banks incorporate the State Bank of India, Punjab National Bank, and Bank of India among others.
Q.30. Distinguish between revenue receipts and capital receipts.
Ans :

Q.31. State the difference between fiscal deficit and budgetary deficit.
Ans :